
In case you haven’t noticed, we’re big data nerds. It probably goes back to kindergarten, when we started collecting baseball cards. Ever since, we’ve been irresistibly drawn to rows and columns of numbers. But we appreciate them not as quantitative expressions but, rather, as narrative vehicles. If you know how to read them, they tell stories.
That’s what we were aiming for when we co-sponsored the 2022 Amputee Community Survey with The Liner Wand, and it’s what we’re teasing out now that the results are available. Last week, ICYMI, we broke down the survey numbers by age group. This week we’re grouping them by reason for amputation, in hopes of learning how (and whether) the experience of people who lose limbs to trauma differs from those who’ve lost limb to diabetes, cancer, infection, and so forth.
Before we continue, we’ll remind you of all the caveats we cited last week: While the survey has a large sample (657 people), it wasn’t conducted with scientific rigor, so all conclusions should be considered in that light. Our numbers no doubt captured a piece of the truth, but far from the whole enchilada. OK? Off we go.
Who participated?
Our 657 respondents cited 100 different causes of limb loss, an alarmingly unwieldy number. Fortunately, most cases fit cleanly into just seven categories:

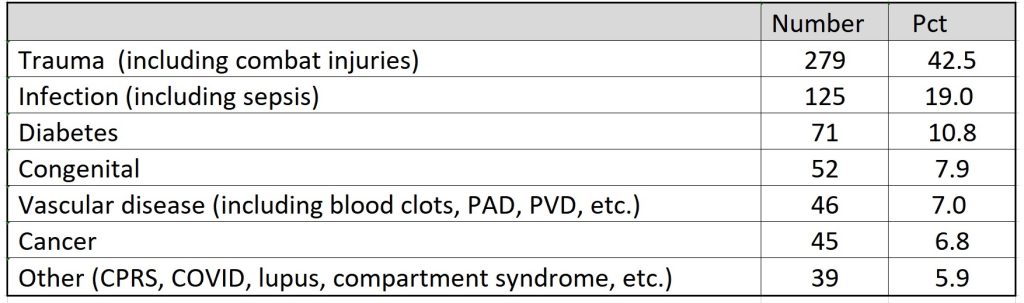
Two items of note. First, the percentage of our respondents who lost limbs via trauma closely tracks the percentage in APMR’s definitive 2008 amputee population study (which found that 45 percent of amputations are caused by trauma). That’s an encouraging point of congruence. Second, while our proportion of respondents citing diabetes is vastly smaller than the number commonly cited from APMR’s study, the APRM figure actually encompasses all dysvascular disease, including diabetes. If we combine our diabetes and vascular categories, it reduces the gap to ~18 vs 54 percent. We might also postulate that, for some of our participants who cited infection as the cause of limb loss, diabetes or vascular disease was implicated in the loss of the limb. (The APMR study didn’t include “infection” as a distinct category.) This would further narrow the discrepancy. No matter what adjustments we make, our survey surely underrepresents the diabetes/vascular population. But the difference might not be quite as massive as it look on first glance.

Who’s using a prosthesis?
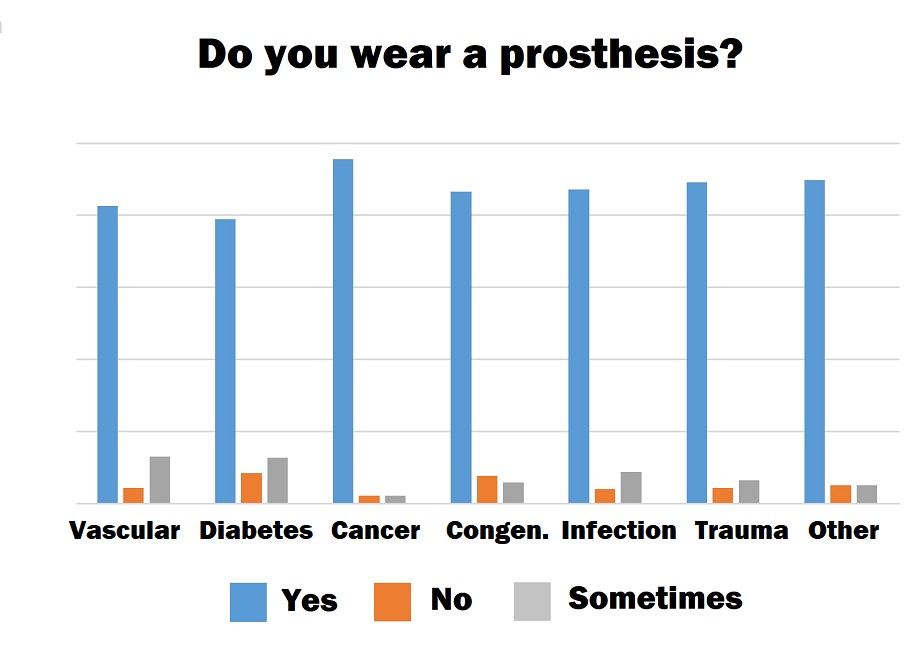
Overall, 88 percent of our respondents answered “yes” to the question “Do you wear a prosthesis?” But a clear division appeared in the data: only 80 percent answered affirmatively in the diabetes and vascular categories, versus an aggregate 89 percent in all other categories. That result tracks with a 2021 study in the Journal of Vascular Surgery which found that amputees with diabetes are less likely than other amputees to get referred to a prosthetist after surgery. Correspondingly, diabetic/vascular amputees are more than twice as likely to say they only use a prosthesis “sometimes” (13 percent) compared to all other categories (6 percent).
Who’s getting regular physical therapy?
Almost a quarter of survey participants who lost their limb due to diabetes or vascular issues are working regularly with a physical therapist. (By “regular,” we mean either weekly or monthly.) In all other categories combined, only 15.6 percent are similarly active. We wouldn’t have predicted that result, particularly not in light of vascular/diabetes patients’ relatively lower use of prosthetic devices. Our money would have been on the trauma cohort, and it wouldn’t have been a terrible wager— 18 percent of that group attends regular PT, placing fourth among the seven cohorts. In another surprise, cancer patients are the least active consumers of physical therapy, with only 4.4 percent attending weekly or monthly.

Who’s participating in adaptive sports programs?
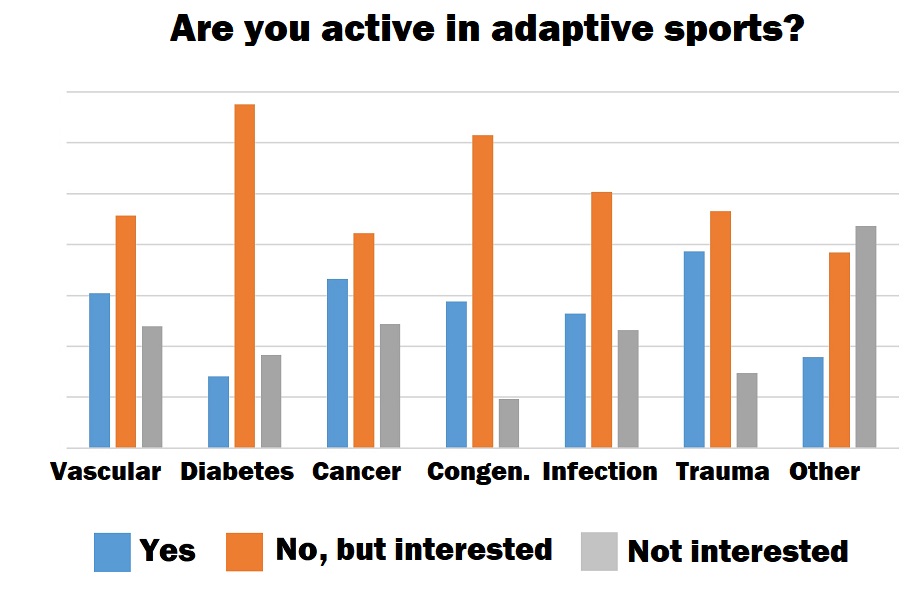
Trauma survivors, front and center. More people in this category are active in organized adaptive sports (108) than all other categories combined (94). In percentage terms, the participation rates are 39 percent trauma, 27 percent all others. This isn’t surprising, insofar as amputation via trauma is disproportionately common among younger people. But we’d like to call the following nugget of information to the attention of Move United, Angel City Sports, Ability 360, Challenged Athletes Foundation, etc.: Although patients with diabetes are least likely to be currently active in adaptive sports (14 percent), they are the most likely to say they’re interested in getting involved (68 percent). That’s a hugely underserved market. Overall, fully half of our respondents say they are not currently active in adaptive sports but would like to be active.
Who’s experiencing the most day-to-day pain?
Once again, the diabetes/vascular group stands out. Nearly a third of this cohort reports regular pain levels of 5 and up (on a 0-10 scale), versus only 23 percent in all other categories combined. The reason for this is distressingly clear: Patients in these categories are the least proactive consumers of pain relief—by which we mean, they’re least apt to venture beyond pain meds and try other strategies. To put some numbers to this: The average person in the diabetes/vascular categories reports they routinely use 2.1 pain-relief strategies (including meds, massage, heat, ice, yoga, CBDs, acupuncture, etc); in all other categories, it’s 2.8 strategies per person. About half of diabetes/vascular respondents use pain medication, which is on par with the full sample. If we had to take a stab at why D/V amputees are less aggressive in treating pain than others, we’d guess that cost plays a big role.
Other tidbits
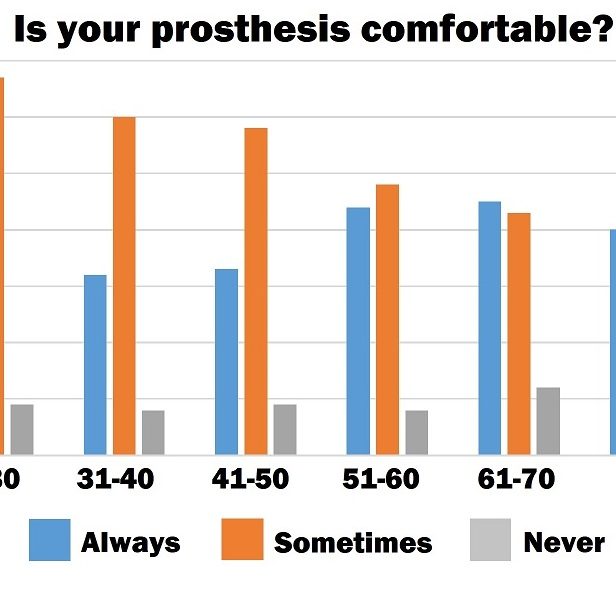
* Respondents in the diabetes/vascular categories were least likely to say their prosthesis is “always” comfortable, at 30 percent (versus 40 percent for all other categories).
* Amputees who lost limbs to cancer are the most enterprising seekers of pain relief. They top all categories in multiple strategies, including medication (62 percent), massage (62 percent), heat (42 percent), ice (38 percent), and compression (31 percent).
* Those who lost limbs to trauma are most likely to use CBDs (23 percent) and meditation/mindfulness (34 percent).
* As you would expect, congenital amputees are vastly less likely to report phantom limb pain than individuals in the other categories. Less expectedly, 21 percent of congenital amputees in our survey do experience phantom limb pain.
* Nearly half of trauma survivors required revision surgery on their amputation (48 percent), followed closely by congenital amputees (42 percent). Diabetes and vascular amputees are least likely to need revisions (27 percent).
* The most regular support-group participants are amputees with diabetes (30 percent). The aggregate rate of attendance among all other categories is 19 percent.