

Just in time for Limb Loss and Limb Difference Awareness Month, the results from the 2022 Amputee Commui-Tee Survey are now available. More than 650 people filled out the questionnaire, doubling last year’s participation rate and providing us with one of the sharpest pictures yet of amputees’ wants, needs, and concerns. You can download the top-line results via our survey co-sponsor, The Liner Wand.
We’ll be sifting through the survey responses all month, teasing out as many insights as our data filters and pivot tables will allow. This week we’re looking into the generational differences among amputees, asking whether (and how) experiences and attitudes differ among varying age cohorts. In the coming weeks we’ll be slicing and dicing along other lines, including gender, cause of limb loss, arm vs leg amputees, and so forth.
A major caveat before we get started: This is not a scientific study, so please evaluate these statistics accordingly. While a survey this large undoubtedly has some value, you shouldn’t regard these numbers as definitive, and we make no claims that they are. To help you understand where our data might be skewed, we call your attention to three ways in which our survey population varies from the most widely accepted demographic estimates of the amputee community (based on a 2008 study published in the Archives of Physical Medicine and Rehabilitation).
Our respondents are disproportionately young. APMR estimated that 80 percent of amputees are at least 45 years old, whereas 59 percent of our respondents fell into that age range. The 2022 survey’s age profile hews much closer to the APMR’s figures than last year’s study did, but it still skews young.
The survey underrepresents people who lost limbs because of vascular disease. According to APMR, dysvascular diseases (including diabetes, peripheral artery disease, blood clots, and related conditions) cause 54 percent of amputations. Only half as many of our survey respondents (27 percent) lost their limb because of vascular issues.
Our sample includes congenital amputees. Eight percent of our respondents either were born with limb difference or had amputations during infancy due to a congenital syndrome. The APMR study excluded congenital amputees entirely, and this partly explains the two discrepancies we cited above. Congenital amputees by definition don’t have vascular-related limb loss, and they represent a disproportionate share of younger amputees. By including them in our survey, we amplified the youth factor and commensurately diluted the representation of other populations. In this respect, our survey is more (not less) representative of the overall limb-difference population than the APMR paper.
With those preliminaries out of the way, here’s some of what we learned when we sorted the data by age cohort.

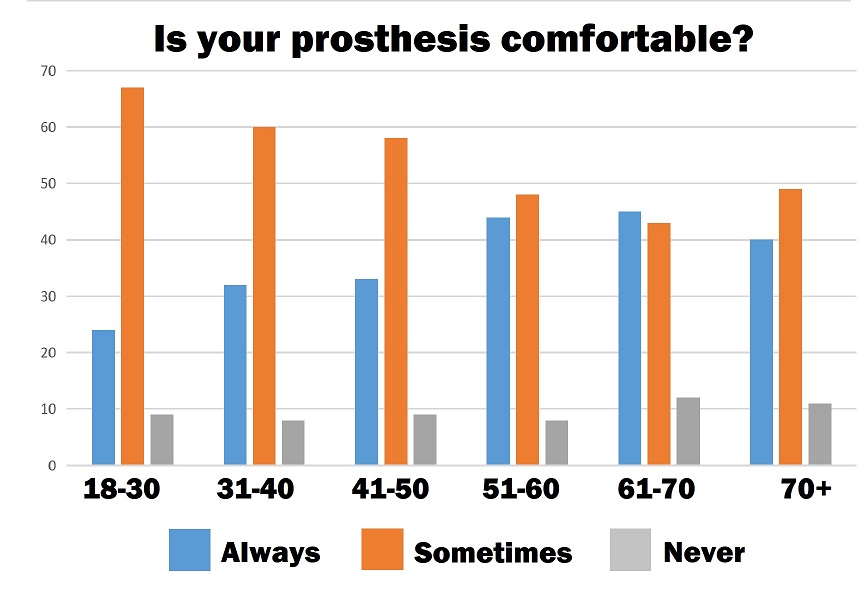
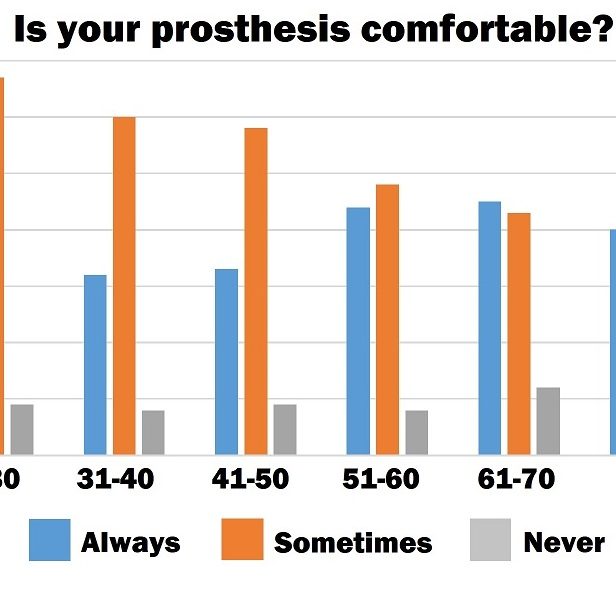
Who’s got the best prosthesis fit?
You’d think achy old folks like us would be more likely than spry youngsters to complain about a problematic prosthesis. Surprise, surprise: Senior amputees don’t kvetch as often as the juniors do. Nearly half of people older than 50 say their prosthesis “always” feels comfortable; fewer than a third of people 50 or younger say the same. In relative terms, people older than 50 are about equally likely to say their prosthesis “always” (44 pct) or “sometimes” feels comfortable (46 percent). But respondents aged 50 and younger are only half as likely to answer “always” (31 percent) as “sometimes” (61 percent). How to explain? Maybe it’s the old-tennis-shoe effect—the longer you live in your own skin, the more comfortable you feel. Or maybe the kids are more physically active, piling up bumps and bruises that we grizzbeards have grown wise enough to avoid. Any other theories? Send us an email.

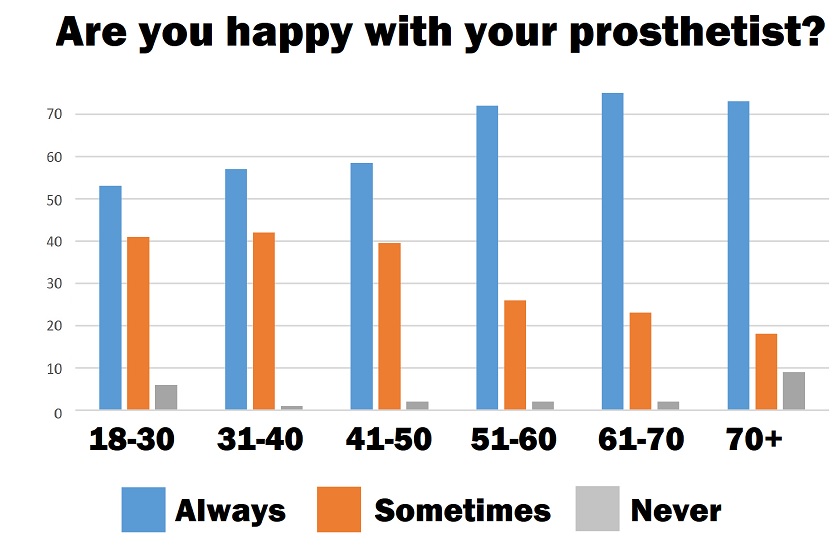
Who’s happiest with their prosthetic care?
Once again, older = happier. Barely half of amputees aged 50 or younger say they are “always” happy with their prosthetist (54 percent), versus nearly three-fourths of those above 50 years old (69 percent). The always-happy customer segment climbs with each decile; 20somethings are less satisfied with their prosthetists than 30somethings, who are in turn less satisfied than 40somethings, and so on up the line. If we had to take a stab at explaining that pattern, we’d guess that people’s expectations for prosthetic performance get progressively lower over time, making them easier to fulfill. Using ourselves (again) as an example: Back in our 30s we demanded that our footwear carry us up multiple 14,000-foot peaks every summer; now, in our late 50s, we rarely burden our soles with anything tougher than a hike in a dog park or farmer’s market. The lower the bar, the easier it is to clear, right? The floor is open for alternative interpretations; let us hear from you.

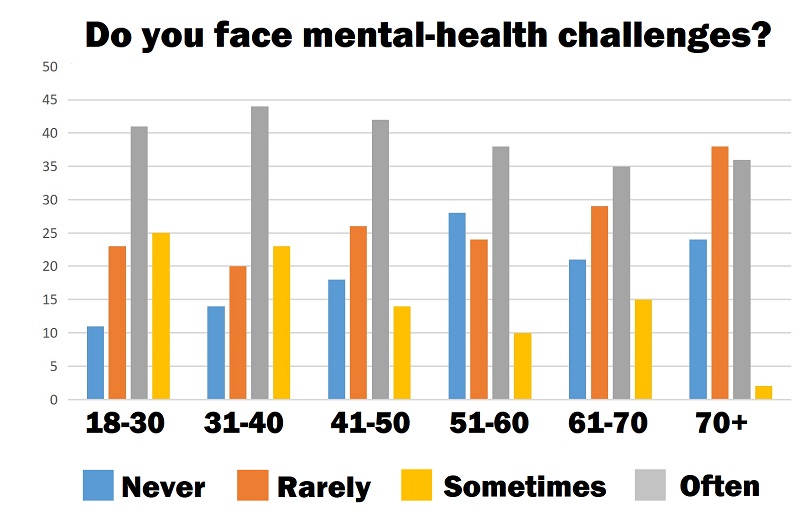
Who’s carrying the heaviest emotional baggage?
Limb loss isn’t easy at any age, but the blues tend to fall heaviest on the young. About a quarter (24 percent) of people age 40 or under say they “often” struggle with the emotional fallout of limb difference; only half as many people over 50 report the same. The numbers are reversed at the other end of the spectrum: Half of the older cohort say they “never” or “rarely” fight mental-health battles because of limb loss, versus only a third of younger amputees. Two obvious explanations for this distribution come to mind. First, many (though not all) older amputees are decades removed from their amputation and therefore have had a long time to adjust, adapt, and work through emotional issues related to limb loss. Second, many amputees (and humans in general) are still forging their identities and cultivating self-knowledge in their 20s and 30s (and even 40s), making amputation that much more emotionally complex and impactful. In a future post, we’ll sort these numbers according to years since amputation. We predict we’ll see a similar gradient (maybe even a sharper one) that shows mental health improving over time.


How does pain treatment vary by age?
Surveywide, the two most popular forms of pain treatment are medication (used by 49 percent of respondents) and massage (46 percent). Distraction comes in a distant third (33 percent), with heat (30 percent) and meditation (29 percent) rounding out the top five. But those overall figures mask some pretty interesting age patterns. For example, amputees over 50 decisively prefer medication over massage (55 to 39 percent, respectively), while under-50s prefer massage to medication by almost the reverse margin (53 to 43 percent). Amputees under 50 are nearly twice as likely to treat pain via compression (29 to 18 percent) or CBDs (20 to 12 percent). One other factoid we noticed: People under 50 are only slightly more likely to treat pain with meds (43 percent) than with distraction (36 percent), while those over 50 opt for medication by nearly a two-to-one margin (55 to 30). While there are surely cultural factors that help explain why younger people turn to pain meds less frequently, cost almost certainly plays a large part. A good chunk of the over-50 cohort pays Medicare prices for drugs, whereas almost nobody under age 50 does.
Other tidbits
A final reminder: This survey is not meant, nor does it claim, to be scientifically significant. We believe there’s worthwhile information in these numbers, but they’re not definitive.
Here are a few other generational faults we noticed as we sifted through the data:
* More than twice as many amputees under 40 received a peer visit (20 percent) compared to amputees over 40 (9 percent).
* Only 11 percent of amputees age 50 or under have no interest in adaptive sports. The other 89 percent are either already involved (32 percent) or would like to participate (57 percent).
* Only 14 percent of amputees over age 50 see a physical therapist on a regular basis, half as many as the under-50 cohort.
* More than a quarter of amputees over age 50 regularly attend a support group (27 percent), nearly twice as many as those in their 30s and 40s (16 percent).
Next week we’ll look at the gender divide.